Open Task Manager with Ctrl+Shift+Esc, go to the Processes tab, and click the CPU, Memory, Disk and Network column headers one at a time. Whichever process stays pinned near the top for 30 seconds is the one slowing your PC. It takes about two minutes and needs no extra software.
That matters more than it sounds. The reflex when a PC feels sluggish is to guess — buy more RAM, clone the drive to an SSD, wipe and reinstall Windows. Task Manager turns that guessing into a diagnosis, and plenty of the time the answer is one app that was launched at startup and never closed.
I’ve relied on this exact routine for years on Windows machines. It has also saved me from at least one hardware purchase I did not need, which is the whole point: diagnose first, spend later.
Table of Contents
- 1What You Need
- 2Step-by-Step: How to Use Task Manager to Find What Is Slowing Your PC
- 3Step 1: Reproduce the Slowdown
- 4Step 2: Open Task Manager
- 5Step 3: Find What Is Slowing Your PC in the Processes Tab
- 6Step 4: Confirm the Process
- 7Step 5: Close, Restart, or Disable the Problem
- 8Common Mistakes
- 9Check Startup Apps and Background Activity
- 10When Task Manager Does Not Show a Clear Culprit
- 11Mac and Linux Alternatives
- 12Frequently Asked Questions
- 13Which Task Manager column should I check first when my PC is slow?
- 14Is 100% CPU usage always a problem in Windows Task Manager?
- 15Why does my memory show high usage even when few apps are open?
- 16Can I end any process in Task Manager without causing problems?
- 17How do I find out which startup programs are slowing down my PC?
- 18What should I do if Task Manager does not show a process using much resources?
- 19Conclusion
What You Need
You need Windows 10 or Windows 11 and nothing else. Task Manager is built into Windows, so there is no download, no install and no third-party utility required.
There are four reliable ways to open it:
- Ctrl+Shift+Esc — works from anywhere, including over a full-screen game. This is the fastest route.
- Ctrl+Alt+Delete — brings up the security screen, then click Task Manager at the bottom.
- Start menu search — type “Task Manager” and press Enter.
- Taskbar right-click — right-click an empty spot on the taskbar (not an app icon) and choose Task Manager.
Windows 11 opens the redesigned Processes tab with app grouping and an Efficiency mode button that Windows 10 does not have. Windows 10 opens a compact view first, and you click More details in the bottom-right corner to get the full sortable table. The readings underneath are identical.
Step-by-Step: How to Use Task Manager to Find What Is Slowing Your PC
Step 1: Reproduce the Slowdown
Before you open anything, write down what you were doing when the machine became slow. Opening a 40-tab browser, joining a video call, launching a game, or copying a folder to an external drive all point at different suspects.
Then do that same thing again and leave the affected application open. Do not restart the PC first — a restart clears the process list along with the evidence, and the reason the machine was slow is frequently gone for a day or two afterward.
One honest warning: opening Task Manager itself takes a moment to render, and on a struggling machine the cursor may stutter while it loads. That brief hitch is Task Manager drawing its own graphs, not the problem you are hunting.
Step 2: Open Task Manager
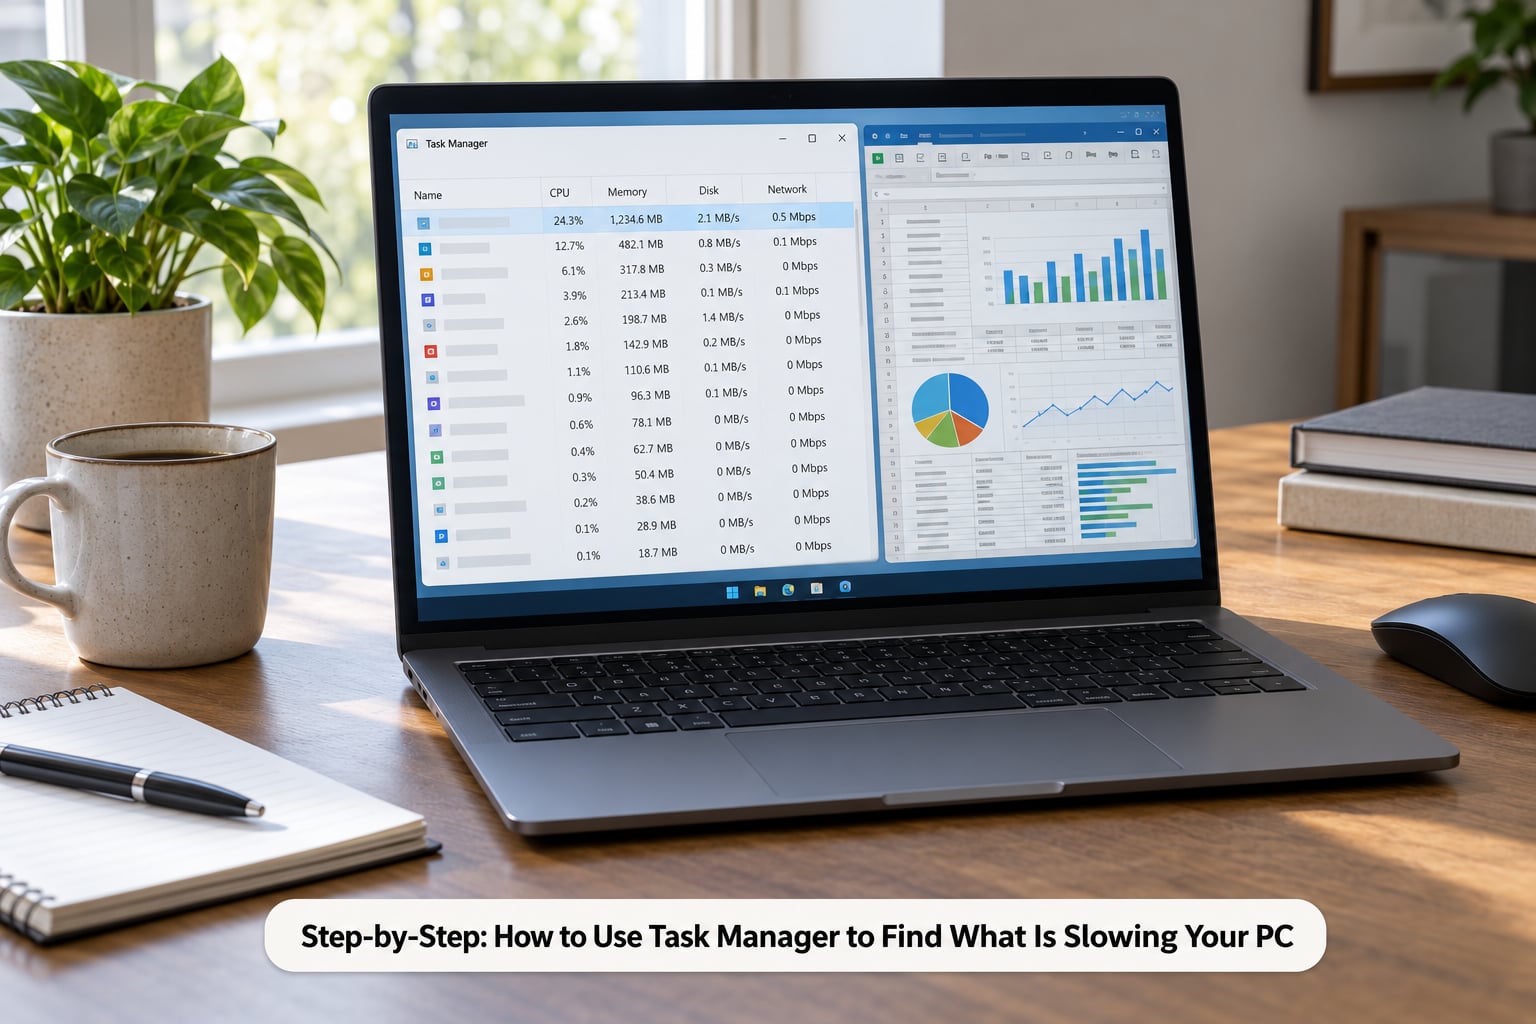
Press Ctrl+Shift+Esc. On Windows 11 you land directly on the Processes tab, sorted with grouped apps at the top and background processes underneath. On Windows 10 you get the compact view — click More details to expand it to the full table with sortable columns.
Either way, look along the top of the window. Those percentages (CPU, Memory, Disk, Network) are averages across every running process, and they are the fastest way to narrow the field. Whichever one sits near 100% is telling you where to look. If CPU is at 6% and memory is at 91%, sorting the process list by memory is the right next move.
Step 3: Find What Is Slowing Your PC in the Processes Tab
Click a column header once to sort descending. Sort by CPU first, then Memory, then Disk, then Network. Each sort takes a second and tells you a different story.
| What you see | What it usually means | What to do |
|---|---|---|
| CPU near 100%, one app on top | A busy application, a runaway loop, or a video export | Close or restart that app; check for an update |
| CPU 20-30% while idle | Usually normal background work, not a fault | Watch it for a minute before acting |
| Memory above 85% | Windows is caching files, which is expected behaviour | Check for a real leak: watch the number climb with nothing open |
| Disk at 100% | Search indexing, a pending update, or a slow mechanical drive | Identify the top disk process; let updates finish |
| Network sending and receiving high | Sync client, cloud backup, video call, or a large download | Pause the transfer or stop the sync |
| GPU 3D near 100% | Normal during gaming or 3D rendering | Nothing to fix; check GPU temperature instead |
Sort by Disk specifically, because high disk usage is the most common cause of lag that CPU readings do not reveal. Many people skip this column and end up chasing a process that was never the problem.
Note what the Disk column on the Processes tab actually measures: disk I/O over a recent sampling window, not how full the drive is. A drive can be nearly empty and still report 100% while it works hard. This distinction trips up a lot of people.
Step 4: Confirm the Process
Watch the top of the sorted list for 30 to 60 seconds. A process that spikes to 90% for two seconds and drops back is normal — that is usually a background compile, a thumbnail rebuild or an app finishing an index. A process that stays high while you sit and watch is your culprit.
Read the Status column before you do anything else. “Running” means it is legitimately in use. “Suspended” means it is frozen mid-operation and is worth restarting. “Not responding” is an app that has hung but Windows has not killed it yet.
On Windows 11, app entries are grouped, so one row may represent a browser with a dozen processes behind it. Click the small arrow at the left end of the row to expand it and see the individual subprocesses and extensions underneath.
If a name means nothing to you, right-click it. Open file location shows you where it lives on disk — software in a Program Files folder is ordinary, while a process running from a random folder in your Downloads directory deserves a closer look. Search online gives you a quick description of what it does. Windows’ own naming convention helps too: entries called System, Registry, Memory Compression, Antimalware Service Executable and Service Host followed by a bracket are Windows components.
Step 5: Close, Restart, or Disable the Problem
Once you know what it is, match the action to the situation:
- An ordinary application is stuck or busy — select it and click End task. Unsaved work in that app is lost, so save first if the app still responds.
- The app is not responding but you want the data — wait. Windows will offer to close it on its own, sometimes offering to save recovery information.
- A background service is the problem — right-click and choose Go to services, then set that service to Manual rather than Disabled.
- Disk is pegged by Windows Update or the Search indexer — leave it alone. These resolve on their own once the pending work finishes.
- The culprit starts every time you log in — handle it on the Startup tab instead of killing it daily.
Some processes refuse to end, or restart instantly. That usually means a parent process relaunches it, or it is protected. Restarting your machine clears the session, but if the same process is back at 90% a minute after login, the root cause is a startup entry or an update that needs to finish.
On Windows 11 you can also right-click a background process and pick Efficiency mode. It deprioritises that process so it gets less CPU time. It is a useful temporary move for a background app, not a fix for a misbehaving one.
Common Mistakes
- Judging a single spike. One moment of high CPU is not a diagnosis. Watch for 30 to 60 seconds and see whether it stays high on its own.
- Reading high memory as a hardware fault. Windows fills free RAM with cached files and releases it on demand. Look for memory that keeps climbing with no apps open, which is the actual signature of a leak.
- Ending Windows or security processes. Do not end System, Registry, Windows Update, SysMain, Antimalware Service Executable, Service Host: Windows Defender or Search Indexer. Ending them can trigger a restart, an update rollback, or a repair scan at the worst moment.
- Disabling essential startup services. Turn off apps, not operating system components. Disabling the wrong entry can remove audio, your mouse’s extra buttons or a security tool you rely on.
- Deleting files based on a process name. Task Manager is a monitor. Removing a program file to “fix” a reading usually breaks an app and leaves the reading unchanged.
- Forgetting Disk and Network. The two most common causes of real-world lag are disk wait and bandwidth saturation, and neither shows up in the CPU column.
Check Startup Apps and Background Activity
If the machine feels sluggish at the login screen or takes a long time to become usable, the culprit is almost never in the Processes tab while you are reading it. It ran and finished before you sat down. Go to the Startup apps tab instead, which is also reachable from Task Manager via the left-hand menu in Windows 11 and the Startup tab in Windows 10.
Click the Startup impact column to sort by how much delay each entry adds. Anything marked High is worth disabling unless you genuinely need it running every boot.
Safe to disable: chat clients, game launchers, cloud sync tools, streaming apps, printer utilities, driver updaters, and anything you installed once and never use.
Leave alone: your antivirus, audio and graphics drivers, hardware support software from the device maker, Microsoft Teams if your work depends on it, and anything you are not sure about. Disabling is reversible — the column flips back to Disabled and you re-enable with one click — so try a few and watch whether boot improves.
The Services tab and App History tab are worth a glance too. App History shows how much data Microsoft Store apps used, including network usage and tile updates, which helps when something eats bandwidth on a metered connection and no desktop app accounts for it.
When Task Manager Does Not Show a Clear Culprit
Nothing maxed out but the PC is still slow is the single most common complaint on tech support forums, and it has several causes Task Manager will not directly reveal.
Thermal throttling. A CPU or GPU that gets too hot reduces its own clock speed. Performance drops while every percentage in Task Manager stays low. Check the temperature readings on the Performance tab, and confirm fans are actually spinning and vents are clear.
A slow mechanical drive. A hard disk at 100% active time with a low read/write speed in MB/s is a drive that is struggling, not malware. The active time percentage tells you the drive is busy; the speed tells you how little work it manages per second. That combination points straight at hardware.
Browser extensions. Ad blockers, coupon finders and developer tools run as separate processes inside the browser, so they only show up if you expand the group in the Processes tab. Try disabling extensions one at a time to isolate them.
Pending updates. A cumulative Windows update that has downloaded and is waiting to install drives disk hard during background maintenance. Restarting and letting it finish often resolves a machine that has felt sluggish for days.
Antivirus scans. Antimalware Service Executable regularly spikes CPU and disk while scanning. It settles down. Watch for a few minutes before concluding anything.
Hardware that is simply underpowered. An older processor with modern browser tabs open will lag even when nothing reaches 100%. If the diagnostics are clean and the machine is many years old, that is the honest answer rather than a software fault.
Two deeper tools are worth knowing. Resource Monitor (resmon) breaks down per-thread CPU, disk queue length and file handles, and it shows the memory breakdown of in use, modified, standby and free. Process Explorer from Microsoft’s Sysinternals suite adds a column showing what each process is waiting on, which is how you find drivers and services blocking hardware access.
Before you spend money on an SSD or extra RAM, diagnose. Swapping an HDD for an SSD fixes slow load times and multi-second stalls and has almost nothing to do with CPU percentages. Adding RAM helps when the memory graph is genuinely pinned. Neither helps when the real problem is a fan or a full disk.
Mac and Linux Alternatives
Task Manager is Windows only. On a Mac, the equivalent is Activity Monitor, open from Applications > Utilities or Spotlight, with the same CPU, Memory, Energy, Disk and Network columns and a Quit button where End task sits.
On Linux, System Monitor does the same job, with a separate tab for viewing open file handles and one for watching network traffic per interface.
The diagnostic logic transfers unchanged: reproduce the slowdown, watch for sustained rather than momentary load, and check disk and network as carefully as CPU.
Frequently Asked Questions
Which Task Manager column should I check first when my PC is slow?
Start with whichever summary percentage at the top of Task Manager is closest to 100%. Sort the Processes tab by that column to name the process responsible. If nothing is high, check Disk and Network, since disk wait and bandwidth use cause lag that never registers on CPU.
Is 100% CPU usage always a problem in Windows Task Manager?
No. A brief spike to 100% while an app compiles, updates or exports is normal, because Windows gives a busy process every available core. It becomes a problem only when one process holds high CPU for 30 seconds or more while the machine feels unresponsive. Watch before you act.
Why does my memory show high usage even when few apps are open?
Windows deliberately fills free memory with cached files so it can hand them back instantly when you need them. That cache shows as used memory and is released on demand, so a high number alone is not a problem. Watch instead for memory that keeps climbing with nothing open, which signals a leak.
Can I end any process in Task Manager without causing problems?
You can end any of your own applications, though unsaved work is lost. Do not end Windows system processes such as System, Registry, Windows Update, SysMain, Search Indexer, Antimalware Service Executable or Service Host: Windows Defender. Doing so can force a restart, roll back an update or trigger a repair scan.
How do I find out which startup programs are slowing down my PC?
Open Task Manager and go to the Startup apps tab, then click the Startup impact column to sort by delay. Disable the High impact entries you do not need, leaving antivirus, drivers and hardware software alone. Restart and compare boot time. Re-enabling takes one click if a feature turns out to matter.
What should I do if Task Manager does not show a process using much resources?
Look at causes Task Manager cannot measure directly: CPU or GPU throttling from overheating, a mechanical drive at 100% active time with low read and write speed, browser extensions, or an antivirus scan in progress. Check temperatures and disk speed on the Performance tab, and update drivers if you still find nothing.
Conclusion
Press Ctrl+Shift+Esc, reproduce whatever made the PC slow, and sort the Processes tab by CPU, Memory, Disk and Network. Watch the top row for a minute rather than a moment, confirm the name with a right-click, then close the app or disable its startup entry.
If nothing is maxed out, check temperatures and disk speed on the Performance tab before you buy any hardware. A two-minute diagnosis has saved people a lot more money than that.